|
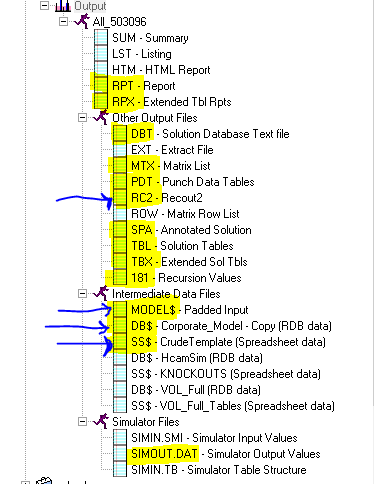
Here is an expanded output tree section where I have highlighted files that File Compare has specific processing to handle – files containing both input and output data. Simple text-based comparison is also available for other “flat” files, such as ROW or LST. To figure out what is different between two cases or runs, you will probably be looking under “Other Output Files” or “Intermediate Data Files”. The data you enter in the database panels is extracted into a “DB$” file, while spreadsheet input files are converted to “SS$”. These are processed along with your crude data, and any old-style .*dat files, by the export program. Export pads the data object names, such as stream codes, into the full GRTMPS 5 naming system. The padded results are concatenated into the MODEL$ file, along with the crude data. In MODEL$ the data is still organized by files so you can easily see where something has come from – but you must also remember that items may be repeated and modified later on. You can create a MODEL$ file with just an Export run. The RC2 file is the final compiled data after it has been merged together by the GRTMPS program. You must do at least a Generate run, or a Datacheck, if you don’t want to do the full LP. These files will only be available if you have marked them to be kept on the Output: Standard panel. |
 |
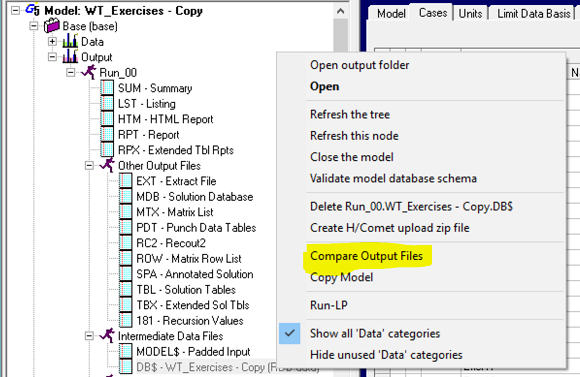
Which files are most useful to compare depends a bit on how the data is organised -- database or tables, one file or many – and if you have an idea where the changes might have been made. And, of course, which files are available as it would be a bit inefficient to save all of them all the time.
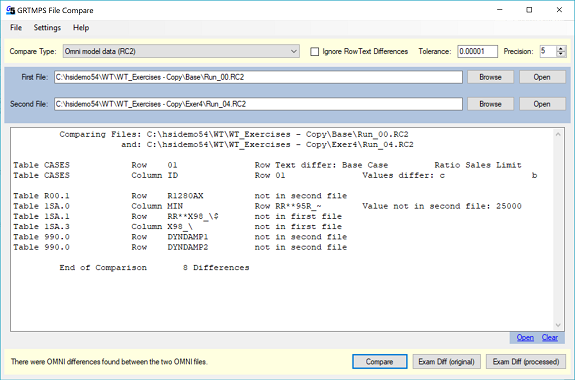
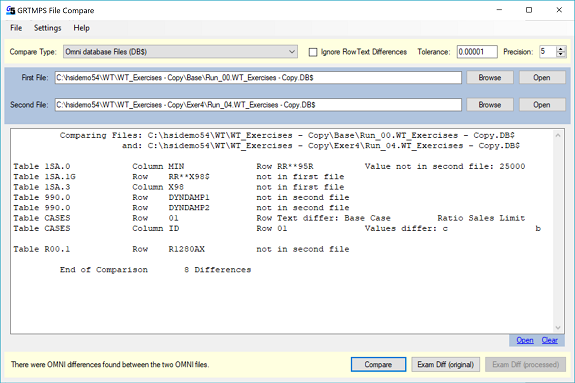
If you have the RC2 files, then these represent what is actually passed to the matrix generation code, all merged together across all data sources – database, database sub-models, crude library files, table-based input files – giving you the final result of any modifications or overlays. (Note that the RC2 file may be set to contain the data tables After Generation on the Output General panel. If so then it will include all the internally generated interim tables as well; very useful for Haverly staff when debugging code, but probably not so much for users, where the Before Generation default is better.) By this point the object names have been padded with the internal markers which identify their nature – so, for example, you see X98_\ in the comparison, while your data would have just used X98. (See Chapter 1 in the GRTMPS Modelling Reference Guide for more information about name padding.) Some file types have additional comparison options. Here, for example, you could tick the “Ignore Row Text Differences” box to eliminate the first mention of Table CASES, as such changes effect reporting, but not optimization. Tolerance sets a minimum absolute delta for a numerical difference to be reported. Precision controls how many digits are displayed for matrix comparisons.
If you are a database model user, your first reaction may well be –“Its all in Tables!”. Sorry, but that’s the common denominator for now, as all the data is translated into this format before actually being used. Please see Note 17) GRTMPS Tables for Database Modellers for advice on mapping the tables back onto the nodes and panels. If you do have database input, you may also find the Change Report (Model node, DB. Mgt) useful for seeing what has been changed within a single model database and on which panels.
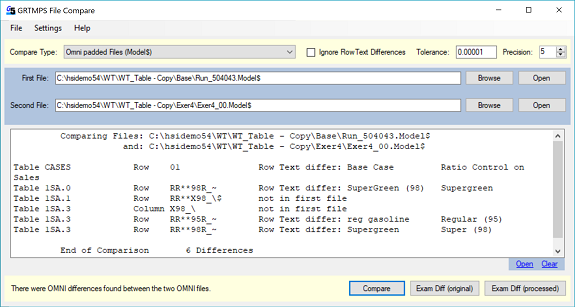
The comparison output looks the same – as the data is merged as it is compared. However, if you open the files in ExamDiff, you will be able to see the distinct sections. Each begins with the note “!Start of data from …….” and then the type and name of file. So here in the table based version of weight demo model exercise 4, the differences are clearly in an additional file that has been added at the end.

| If you don’t see the ExamDiff buttons on your File Compare window, you need to use the Settings menu to tell the program where to find it. A basic share-wear version of ExamDiff is installed with GRTMPS in the main application folder – below is the default location – if it is not there on your machine, go to the g5 user interface and select Tools – System Tools - GRTMPS System Folders to find out where yours is installed. The application folder is given in the first box.) |
 |
If you have data in spreadsheets, you could save and compare the SS$ files, but it is probably more efficient just to compare the spreadsheets directly. Here is an example of comparing the crude files for Forties from the weight demo models released with 5.3 and 5.4

There are many small differences as they were generated from different versions of H/CAMS. To make it easier to see the more significant changes, set the tolerance to 0.01
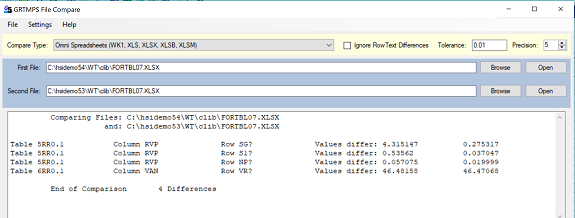
Now you see the fewer much larger differences- and something has clearly happened with the RVP values for the straight run naptha.
And finally, if you do have a very big list of differences, or you want to save it for future reference, hit the Open button down at the bottom to open the comparison results in a text editor, while you work your way through understanding what's changed.
24th April 2018.
Comments and suggestions gratefully received via the usual e-mail addresses or here.
You may also use this form to ask to be added to the distribution list so that you are notified via e-mail when new articles are posted.